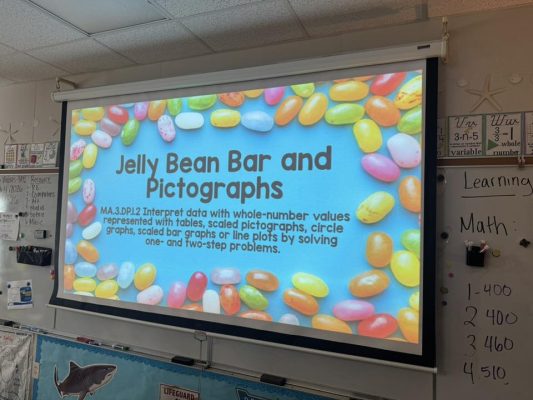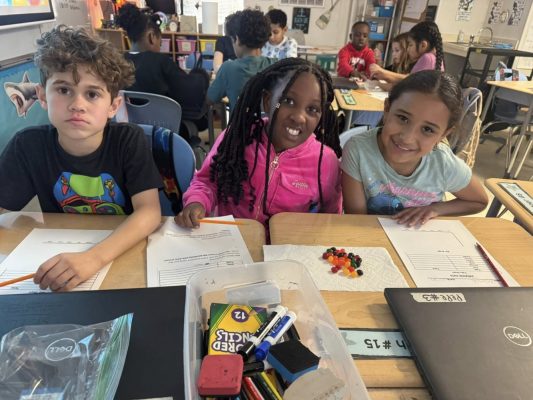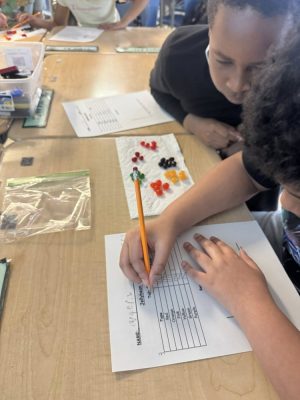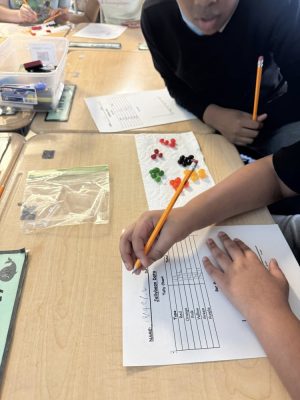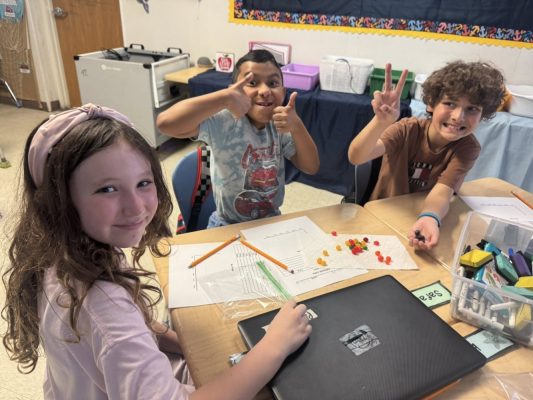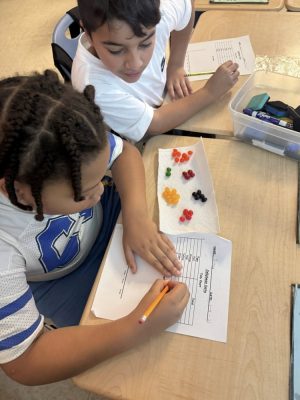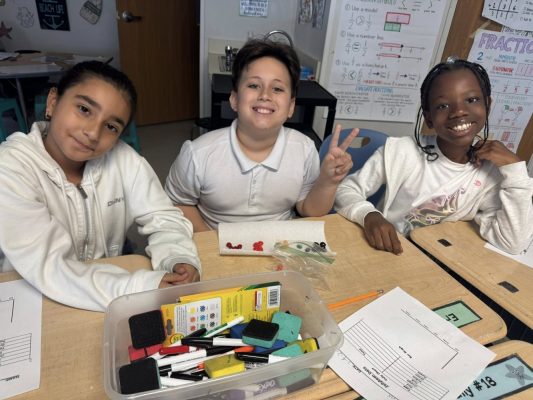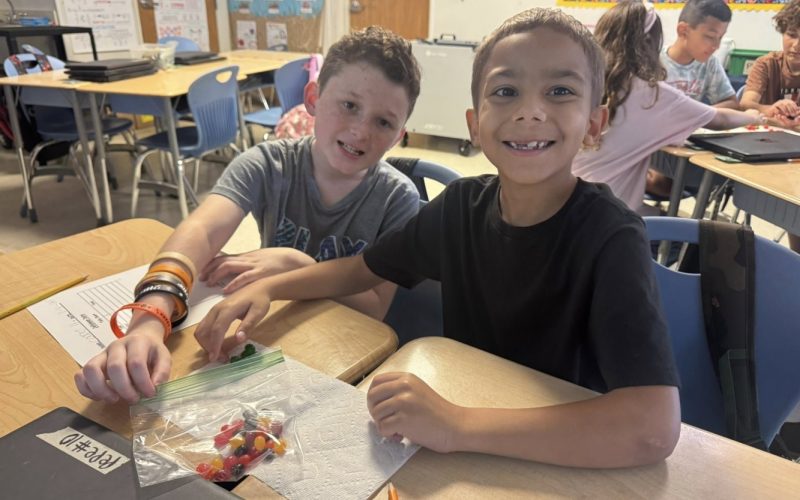
Shark Nation third graders enjoyed a sweet math lesson while working with a partner to collect and organize data using 30 jellybeans. Students sorted the jellybeans by color, carefully counted each group, and recorded their results. They then represented the data in two different ways by creating a bar graph and a pictograph. This hands-on activity helped students strengthen counting skills, compare quantities, and understand how the same information can be shown in multiple representations. Engagement was high, collaboration was strong, and learning was meaningful and fun. Ask your child which jellybean color had the most and how they showed their thinking on their graphs during math time this week together!