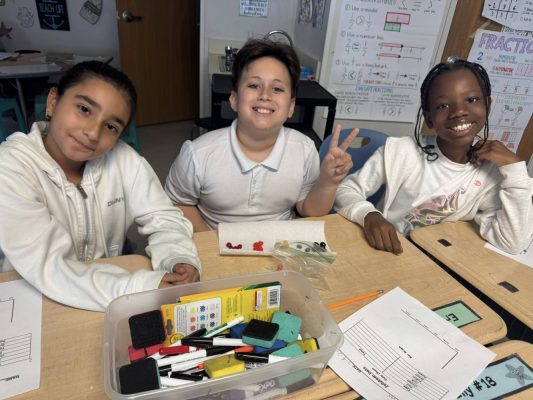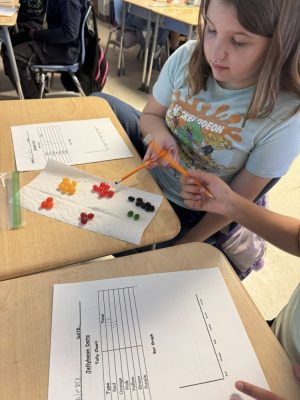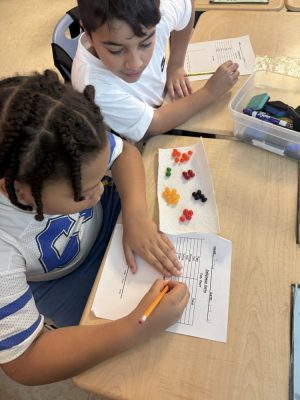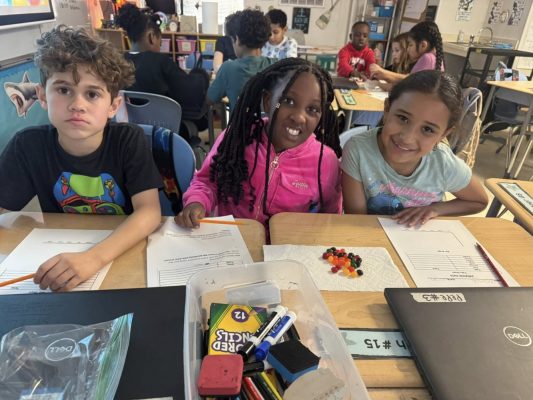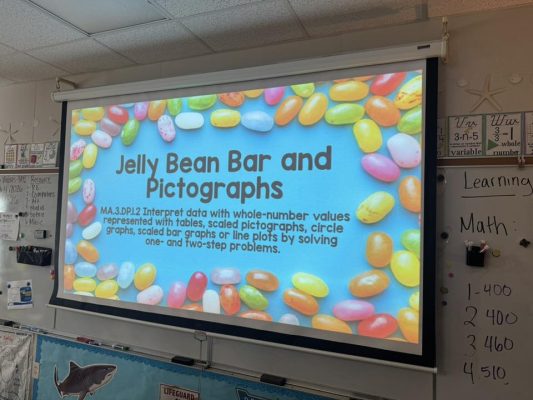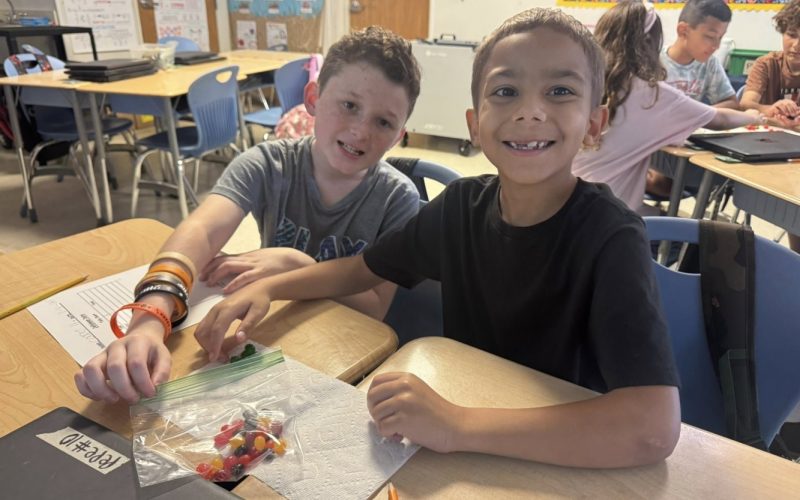
St. Lucie West K-8 third graders enjoyed sweet learning! Students worked with a partner using 30 jellybeans to collect and organize data. They sorted the jellybeans by color, counted each group, and then represented their data in two different ways—a bar graph and a pictograph. This hands‑on activity helped students practice counting, comparing quantities, and understanding how data can be shown in multiple representations. The engagement was high, teamwork was strong, and learning was sweet! Then each child was asked to explain which color had the most and how they showed it on their graphs, including why graphs help organize information clearly.